Contents Menu Expand Light mode Dark mode Auto light/dark, in light mode Auto light/dark, in dark mode Skip to content
P3 Analysis Library
P3 Analysis Library

Introduction

  • Getting Started
  • P3 Analysis
  • Collecting P3 Data

Tutorial

  • Examples
    • Cascade Plots
      • Simple Cascade
      • Customized Cascade
    • Metrics
      • Understanding Data Projection
      • Working with Application Efficiency
      • Handling Software with Multiple Components
    • Navigation Charts
      • Simple Navigation Chart
      • Customized Navigation Chart
  • Case Studies
    • BabelStream
      • BabelStream Cascade Plot
      • BabelStream Navigation Chart

Reference

  • p3analysis package
    • p3analysis.data package
    • p3analysis.metrics package
    • p3analysis.plot package
      • p3analysis.plot.backend package
    • p3analysis.report package

Contributing

  • How to Contribute
  • GitHub
  • Notices and Disclaimers
Back to top
View this page

Navigation ChartsΒΆ

Navigation charts show the performance portability and code convergence of each application, highlighting the tradeoff between performance (portability) and programmer productivity.
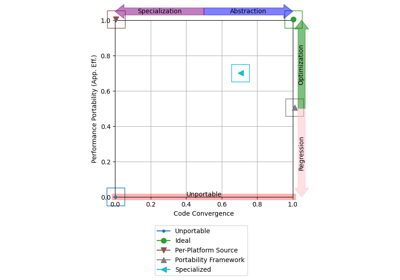
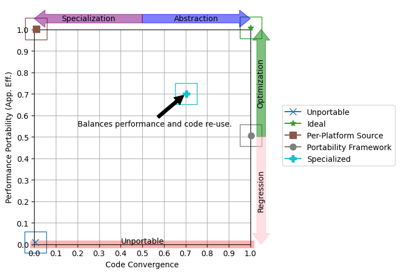
Simple Navigation Chart

Simple Navigation Chart

Customized Navigation Chart

Customized Navigation Chart
Next
Simple Navigation Chart
Previous
Handling Software with Multiple Components
Copyright © Intel Corporation. Intel, the Intel logo, and other Intel marks are trademarks of Intel Corporation or its subsidiaries. Other names and brands may be claimed as the property of others.
Made with Sphinx and @pradyunsg's Furo